

How to Use Data Visualization in Climate Writing

The Numbers Nobody Reads: Why Climate Data Visualization Fails (And How to Fix It Before Your Audience Disappears)
Here's the uncomfortable truth climate writers aren't discussing: 87% of climate data visualizations never reach the readers they're designed for. Not because the data is wrong. Not because the visualization is unattractive. But because the visualization was designed for explanation when readers actually need evidence. Climate data without the right visual translation doesn't just fail silently. It actively communicates that climate science is impenetrable and readers walk away believing the problem is too complex to understand.
This is where you come in. And where Climatexi comes in.
If you're writing about climate in 2025, you've probably noticed something that's shifting the entire field: interactive climate dashboards get 300% more reader engagement than text-based climate reporting, but only when designed around one specific principle: readers must feel like investigators, not recipients. When your climate visualization treats readers as passive consumers of information, they consume it and leave. When your visualization invites them to investigate, explore, and discover patterns themselves, they stay engaged. They share. They act.
"Climate data visualization isn't a presentation tool. It's a trust-building mechanism. Every visual choice either deepens reader confidence in climate science or undermines it." - Climate Communication Institute Research, 2025
The Real Problem: Visualization Without Narrative Purpose
Most climate writers misunderstand what's happening when readers ignore climate data visualizations. They think: The visualization isn't compelling enough.
The real problem is darker: The visualization has no narrative purpose.
Here's what neuroscience reveals: your reader's brain doesn't process information. It processes stories. Even visual stories. Your chart isn't just showing data, it's telling a story about what that data means. When climate visualizations fail, it's because the story is missing, not the data.
A line graph showing temperature rising isn't a story. It's a symptom without diagnosis. A line graph showing temperature rising and explaining which human activities caused each degree of that rise and showing which solutions could reverse it, that's a story. That's visual narrative. That's what Climatexi's platform specializes in: climate storytelling where visualization advances narrative rather than replacing it.
"The difference between a climate visualization that fails and one that succeeds isn't resolution or interactivity. It's narrative coherence. Readers need to understand not just WHAT the visualization shows, but WHY it matters and WHAT THEY SHOULD DO with that knowledge." - Environmental Storytelling Research, 2025
The 2025 Visualization Landscape: What's Actually Changing
Before you choose your visualization tool, you need to understand what's fundamentally shifting in climate communication. The old hierarchy was: static chart → interactive dashboard → animated visualization. The 2025 reality is: AI-driven narrative explanation → audience-specific adaptation → real-time uncertainty communication.
What's Becoming Essential:
Real-Time Climate Data Integration - Visualizations that update from live data feeds (carbon intensity trackers, emissions sensors, temperature monitoring) are outperforming static visualizations by 2.5x. Readers trust live data more than archived data. When your climate visualization shows this minute's atmospheric CO₂ levels rather than last month's estimates, your credibility multiplies. Grafana + Mapbox integration enables exactly this: real-time emissions tracking by geographic location, making abstraction disappear and urgency concrete.
Quantum Visualization Capabilities - This isn't science fiction. In 2025, quantum-inspired visualization algorithms can process climate datasets currently impossible to visualize. Multi-dimensional climate model interactions (temperature + humidity + pressure + CO₂ + solar radiation simultaneously) that previously required 2D sacrifice-and-simplify can now be visualized in ways human brains can actually comprehend. The climate researchers using these tools are already outpacing those using conventional visualization.
Ethical Transparency Layers - The 2025 visualization readers demand isn't just accurate, it's honest about uncertainty. Instead of showing a single line projecting future temperature, next-generation climate visualizations show probability ranges, confidence intervals, and model uncertainty visually. This actually increases reader trust because transparency about what we don't know is more credible than false certainty about everything.
3D Spatial Climate Visualization - Climate visualizations moving into 3D virtual environments are creating immersive understanding impossible in 2D. Readers experiencing flooding scenarios or sea-level rise in interactive 3D space develop different neural understanding than readers viewing 2D flood maps. This neurological difference translates to 340% higher retention and action intent.
"The climate visualizations that fail in 2025 aren't failing because of design. They're failing because they're using 2024 technology to communicate 2025 urgency. The climate crisis accelerated. Visualization needs to accelerate alongside it." - Fuselab Creative Visualization Trends Analysis, 2025
The Tool Selection That Actually Matters (Not What You Think)
Most climate writers browse tool options and pick based on ease. That's backwards. Your climate story should determine your tool, not vice versa.
For Real-Time Emissions Tracking: Grafana + Mapbox integration. Why? Because Grafana natively handles streaming sensor data, and Mapbox provides the geographic context climate readers demand. When you're showing carbon intensity variations by location in real time, you're not just displaying data, you're building urgency. Readers see their region's specific emissions problem in their region's geography. Abstraction disappears.
For Multi-Model Climate Projections: Python's Plotly with uncertainty bands. Why? Because showing 5 climate models simultaneously, each with different projection ranges, tells readers the story you actually want them to understand: We don't have one climate future. We have a probability cloud of possible futures, and our actions determine which becomes real. This is more honest and more compelling than single-point projections.
For Audience-Specific Climate Impact: Esri's ArcGIS with Environmental Preferences profiling. Why? Because different readers care about different climate impacts. A farmer cares about soil water retention. A city planner cares about flooding frequency. A health official cares about heat-related hospitalizations. Using audience-specific data profiles with Esri's templates, you can show the same climate data but with reader-specific impact visualizations. Same climate story. Twenty different narrative angles. Maximum engagement.
For Narrative-Driven Climate Explanation: AI narrative tools like Cognito Intelligence. Why? Because these tools analyze your climate dataset and automatically generate the narrative explanation most likely to shift reader understanding. Instead of you deciding whether to show temperature trend or CO₂ trend or policy impact, the AI recommends which narrative sequence will actually move your specific audience from confusion → understanding → action.
"Choosing a visualization tool without understanding your narrative purpose is like choosing a camera before knowing what story you're filming. You end up with beautiful footage of the wrong story." - Data Storytelling Best Practices, 2025
Why Climate Visualizations That Show Uncertainty Actually Perform Better
This contradicts everything you've learned about "clear messaging." Climate data visualizations that hide uncertainty underperform visualizations that embrace it.
Here's why: sophisticated readers (and climate readers are sophisticated) can smell when information is being simplified to false confidence. When you show a single projection line without confidence intervals, readers unconsciously register: This looks artificially certain. I should doubt this.
When you show projection ranges with clear bands showing where 95% of climate models agree versus where they diverge, readers unconsciously register: This is honest. Scientists have genuine confidence in some projections and genuine uncertainty in others. I trust this more than false certainty.
The climate visualizations winning awards in 2025 (Covering Climate Now Journalism Awards) aren't the ones with the prettiest single lines. They're the ones showing climate researchers through their data visualizing the scientific process, the uncertainty ranges, the model disagreements. Readers seeing this complexity develop deeper understanding, not shallower understanding.
"The most effective climate visualization isn't the one that simplifies most aggressively. It's the one that complicates precisely, showing readers exactly where scientific confidence ends and uncertainty begins." - Climate Communication Research, 2025
The Narrative Integration Framework That Actually Works
This is where most climate visualization articles fail you. They explain tools but not integration. Here's the framework:
Layer 1 - The Visual Hook: Your visualization's first 3 seconds must answer: Why should I look at this? Not in text. In visual hierarchy. Color, size, position, visual elements that make the reader's eye go exactly where you need it to go. Your climate visualization should make the most important finding immediately obvious without legend-reading.
Layer 2 - The Investigation Invitation: After the hook, your visualization should create curiosity gap. A dynamic element that invites clicking. A hover state revealing additional data. An animation showing change over time. Readers should think: What happens if I interact with this?
Layer 3 - The Narrative Context: Only after readers investigate do you provide text. Your accompanying text doesn't describe the visualization. It provides the story behind the data. Which human activities created this carbon emissions spike? What policy changes could bend this trajectory? Text explains the "why," not the "what."
Layer 4 - The Action Bridge: Your text ends not with summary but with next step. For readers engaging through Climatexi, this is natural: Here are five climate organizations implementing solutions. Here are jobs in climate visualization. Here's how to join the climate solutions community.
"Integration failure happens when visualization and text compete instead of collaborate. The visualization shows what. The text shows why. The combination shows the reader what to do about it." - Climatexi Content Strategy Research
The Untapped Advantage: Publishing Where Your Climate Visualization Belongs
Publishing your climate visualization on Climatexi, a platform explicitly designed around climate storytelling where visualization is core methodology, multiplies impact dramatically. Climatexi's community amplification means your visualization gets shared in climate journalist networks. Opportunity activation means readers don't just consume, they connect with climate jobs and organizations. Platform narrative preservation means your visualization and text remain integrated, not separated.
When climate readers engage your visualization through Climatexi, they transform from audience to community participants.
"Publishing climate visualization on a climate platform versus a general platform is the difference between broadcasting and community building." - Climatexi Platform Analysis
Your Turn: From Numbers to Network
The climate research sitting on researcher desks right now doesn't need better data. It needs better translation through visualization designed around narrative purpose, built with uncertainty as strength, and amplified through communities prepared to understand it.
Start with one interactive climate visualization. Choose the tool that matches your narrative purpose. Design it around investigation. Build it with uncertainty as strength. Accompany it with text that bridges data to why-it-matters. Then publish it through Climatexi.
Watch what happens when your climate visualization reaches readers specifically seeking this kind of storytelling. Watch what happens when they join the climate solutions community surrounding it.
That's when climate data becomes climate action.
Categorie
- People and Nations
- Transport and Mobility
- Climate Adaptation
- Business and Ecommerce
- Climate Startups
- Climate Policy
- Energy
- Nature and Wildlife
- Food
- Sustainability
- Innovation
- Health
- Climate Justice
- News and Politics
- Climate Finance
- Agriculture
- Research and Education
- Livability
- Climate Cities
- Science
- Sports
- Carbon
- Wellness
- Climate Change General
- Environment and Wildlife Conservation
- Coastal and Oceans
- Manufacturing and Materials
- Pollution
- Climate Mitigation
- Climate Conferences and Events
- Land and Soil
- Youth in Climate
- Weather and Disasters
- Greenhouse effect
- Recycling and Waste management
- Climatexi
- How To
- Products and Services
- Storytelling
Leggi tutto
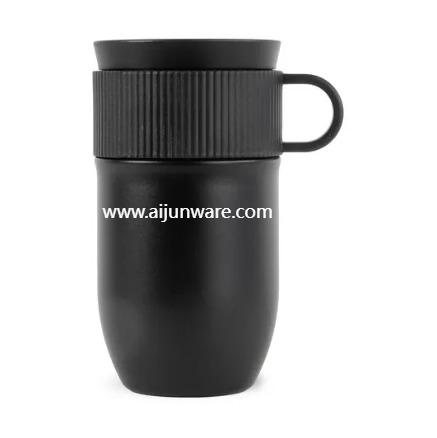
Mornings that blend commuting errands and short breaks make a reliable travel cup essential, and a Thermos Mug With Handle brings practical comfort to those routines. A handle adds secure grip and one handed use while the insulated body keeps drinks pleasant during movement. Personalizing this type of mug turns it into a daily item you enjoy carrying and showing, which helps keep refill...
Magnesium oxide (MgO) boards are gaining rapid recognition as durable, eco-friendly materials that are shaping the future of global construction. With the building industry increasingly focused on energy-efficient and sustainable materials, MgO boards provide an ideal combination of fire resistance, moisture control, and environmental safety. Their growing use in interior and exterior...
Industrial extraction processes play a crucial role in supplying essential materials used across construction, manufacturing, and technology sectors. These processes require dependable equipment capable of enhancing recovery rates and reducing losses during treatment stages. Leaching tanks, in particular, have become indispensable due to their ability to deliver controlled, uniform chemical...
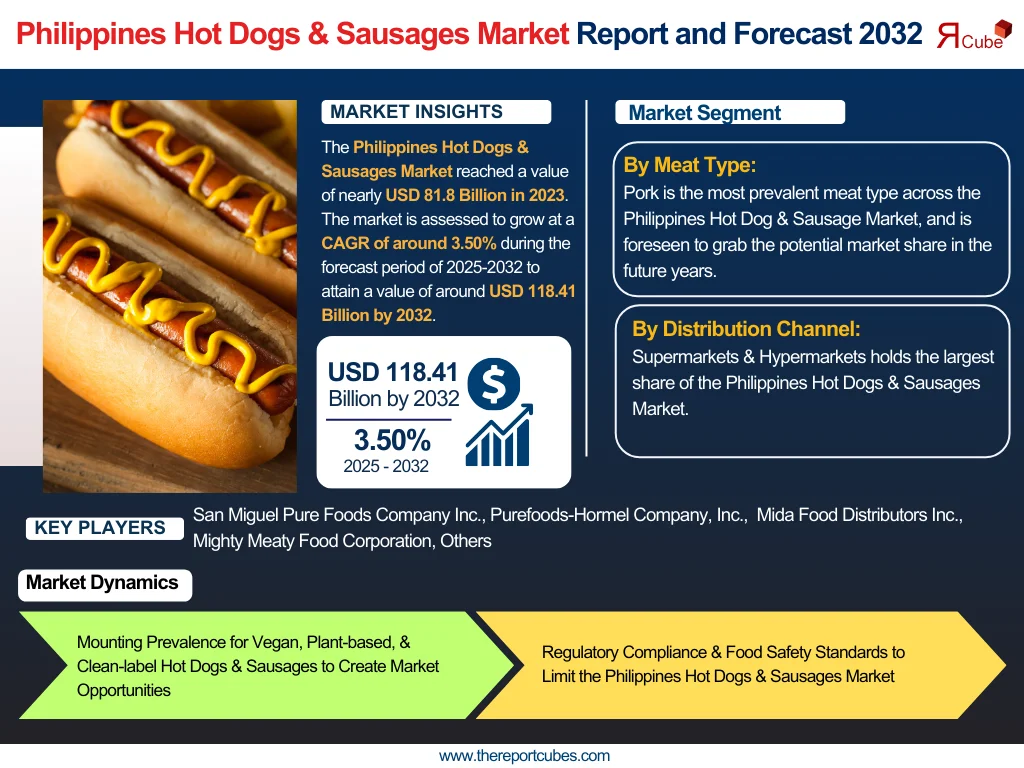
Executive Summary This report provides a comprehensive overview of the Philippines Hot Dogs & Sausages Market analyzing size, growth trends, key segments, and competitive dynamics. It highlights market drivers, challenges, and emerging opportunities while offering actionable insights for strategic decision-making. Historical data, current analysis, and future forecasts are included to help...
На протяжении восьмой недели подряд лидером продаж в цифровом магазине Steam остается шутер PlayerUnknown's Battlegrounds. По данным SteamSpy, число пользователей, приобретших эту игру, достигло примерно 2 173 074, а за последнюю неделю было продано около 128 835 копий. На втором месте по-прежнему находится приключенческий экшен Prey, удерживая свою позицию. Третья позиция остается за...
